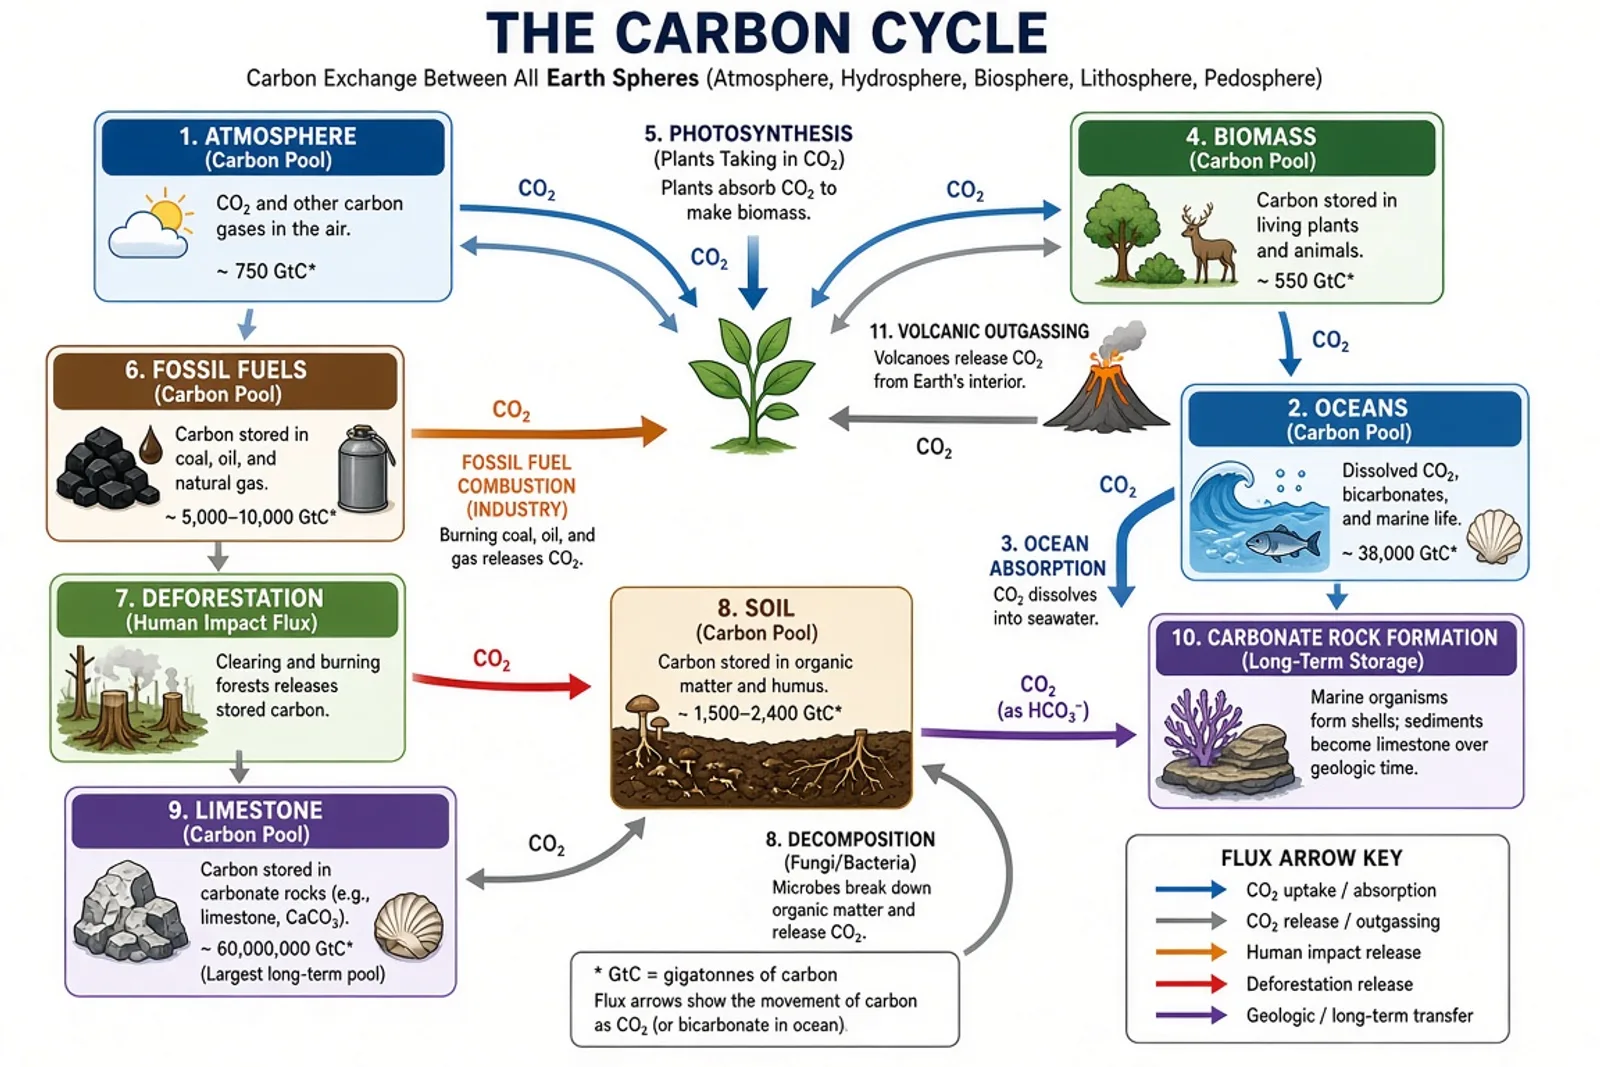
A simple carbon cycle figure should show where carbon is stored and how it moves, without implying that every transfer has the same size or speed. Start with atmosphere, plants, animals, soils, oceans, sediments, rocks, and fossil-carbon reservoirs at the level needed by the audience. Add photosynthesis, respiration, decomposition, ocean exchange, burial, weathering, volcanism, combustion, and land-use change selectively. Use arrow labels rather than relying on color alone, and do not add numerical fluxes unless they come from a cited dataset.
Carbon Cycle Diagram — AI Generator
Draft a carbon cycle diagram that distinguishes carbon reservoirs from transfer processes across the atmosphere, biosphere, hydrosphere, and geosphere. Choose a simple classroom overview or a more detailed systems figure, then verify every flux.
- Distinguish reservoirs from transfer processes
- Separate short biological flows from long geological storage
- Label human influences without inventing flux values
- Verify arrow direction and the chosen level of simplification
Prompt
Create a labeled carbon cycle diagram with distinct reservoirs for the atmosphere, terrestrial plants, animals, soils, surface ocean, deep ocean, marine sediments, carbonate rocks, and fossil carbon. Show transfers through photosynthesis, respiration, decomposition, air-sea exchange, burial, weathering, volcanism, fossil-fuel combustion, and land-use change. Use clearly directed arrows, short process labels, a clean earth-systems layout, and no invented numerical flux values.
Scientific illustration resources
Prompt the subject, then verify the science
Use the matching prompt guide to refine this draft. Before publishing, check every label, structure and relationship against an authoritative source or a qualified subject expert.
Related images
More earth-science entries from the same generator
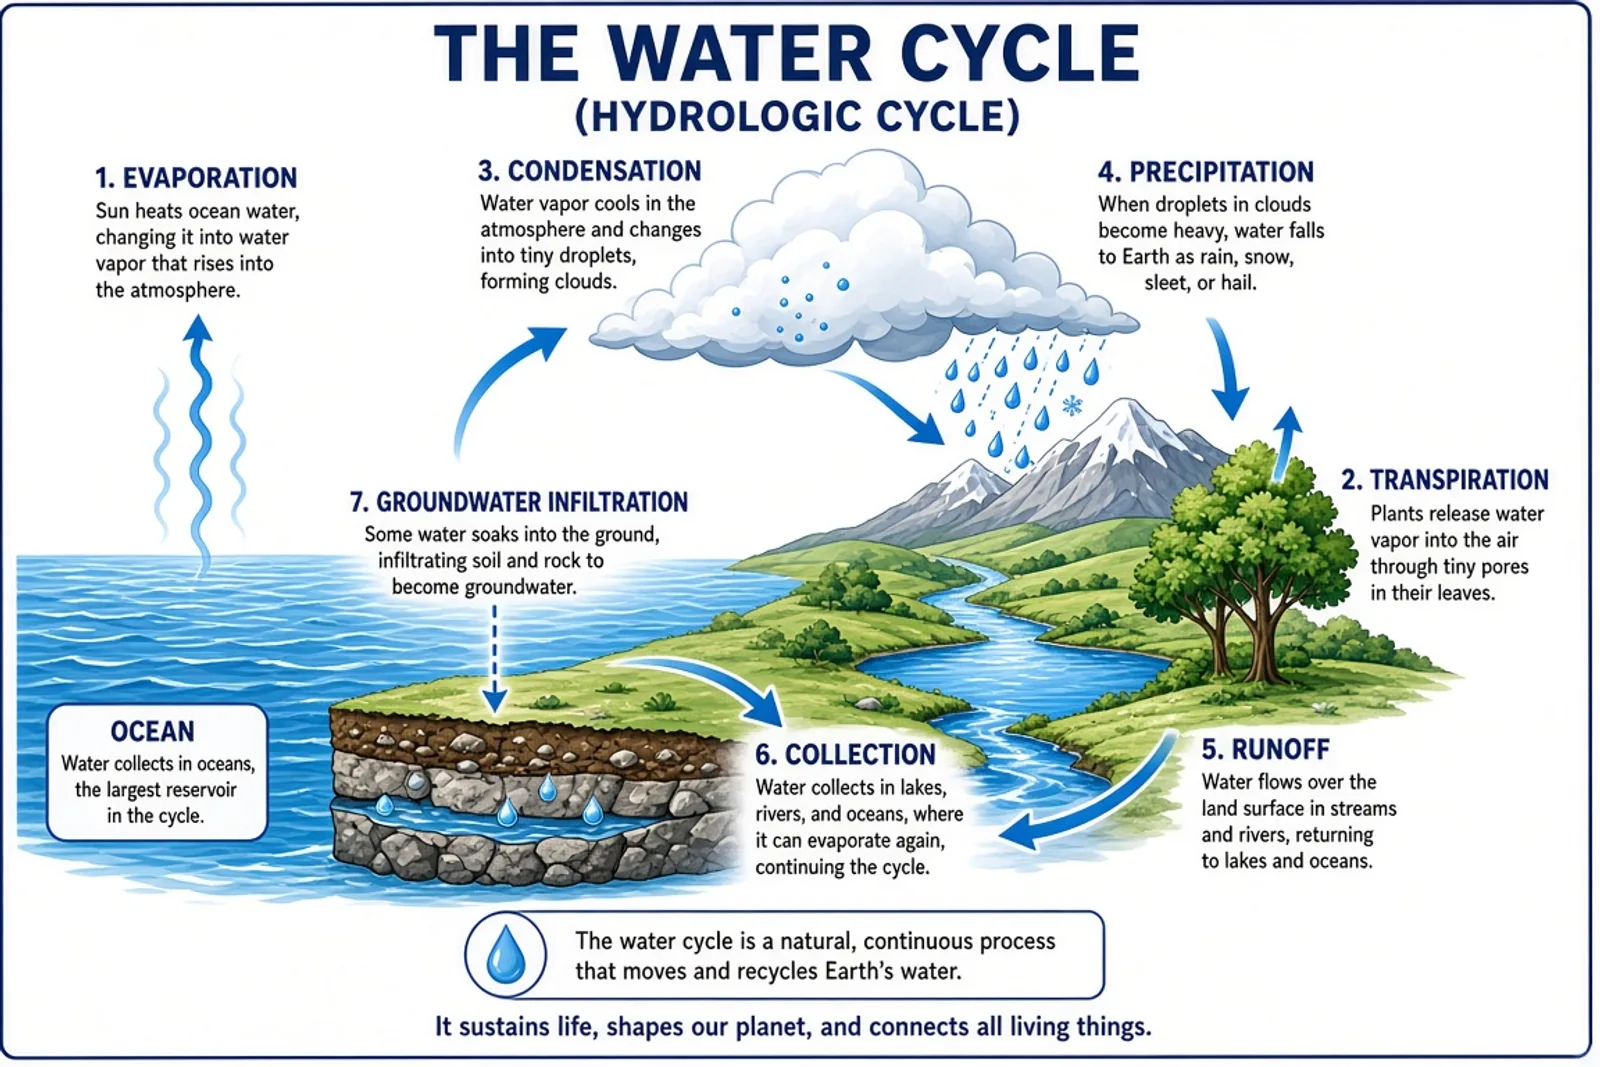 Water Cycle Diagram — AI GeneratorView · earth-science
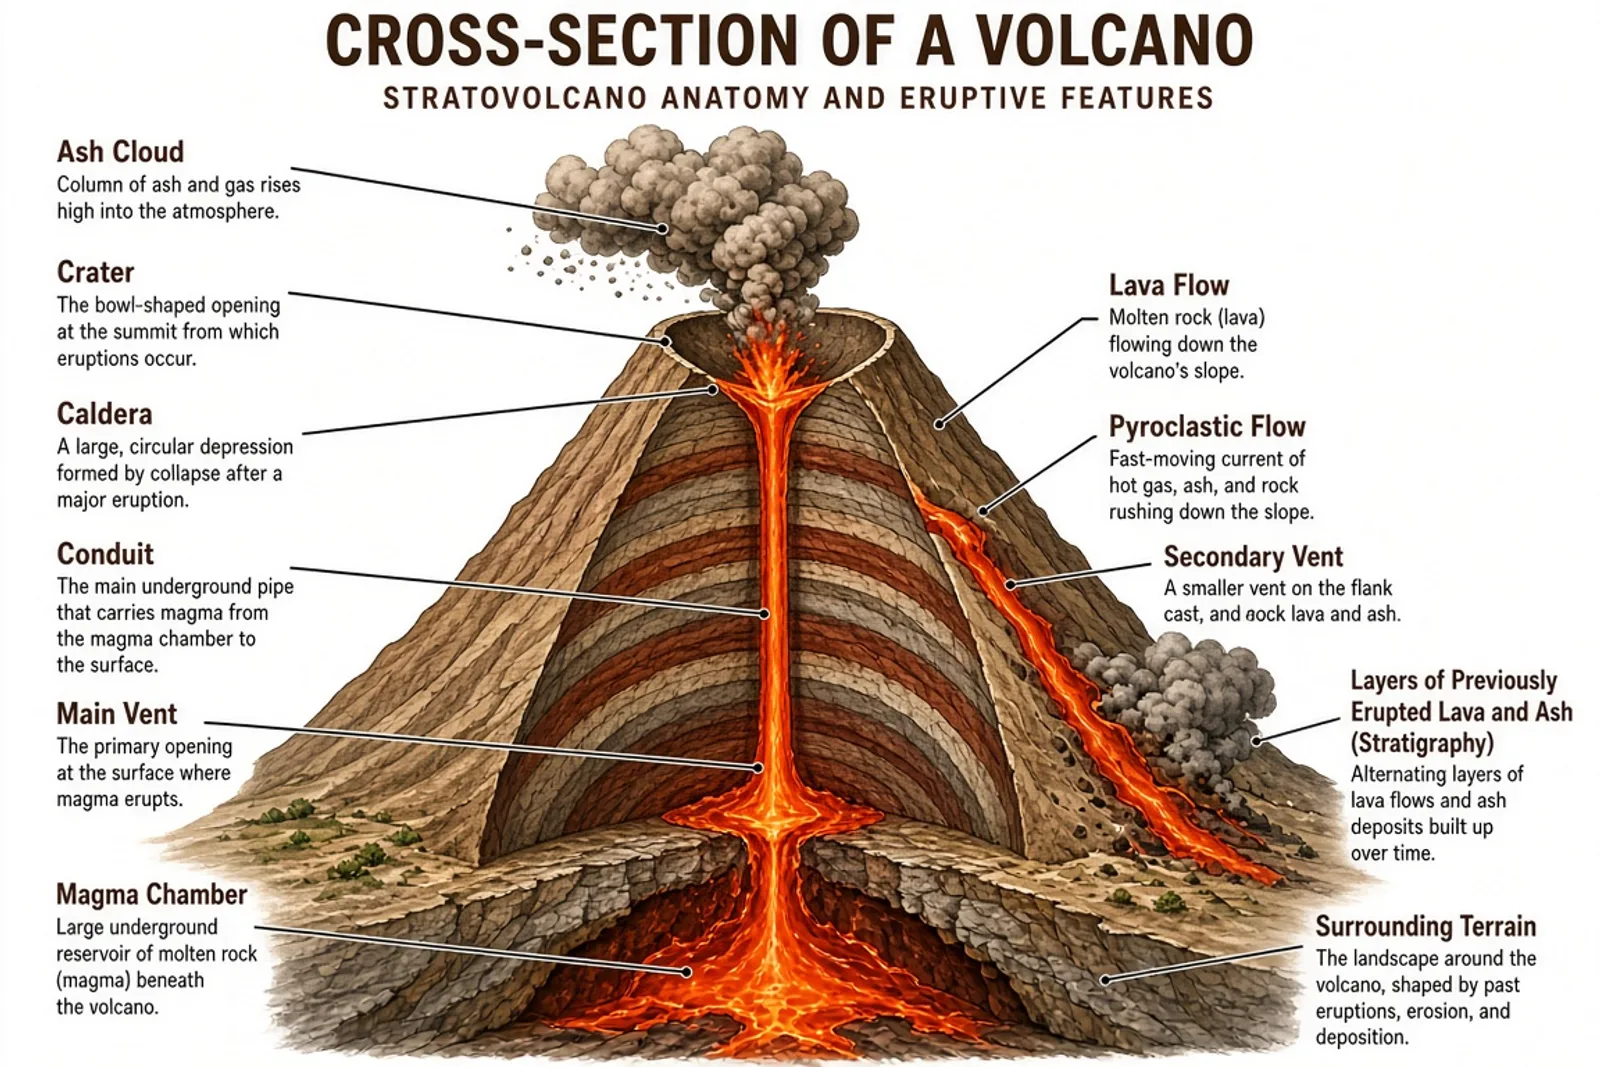 Volcano Diagram — AI GeneratorView · earth-science
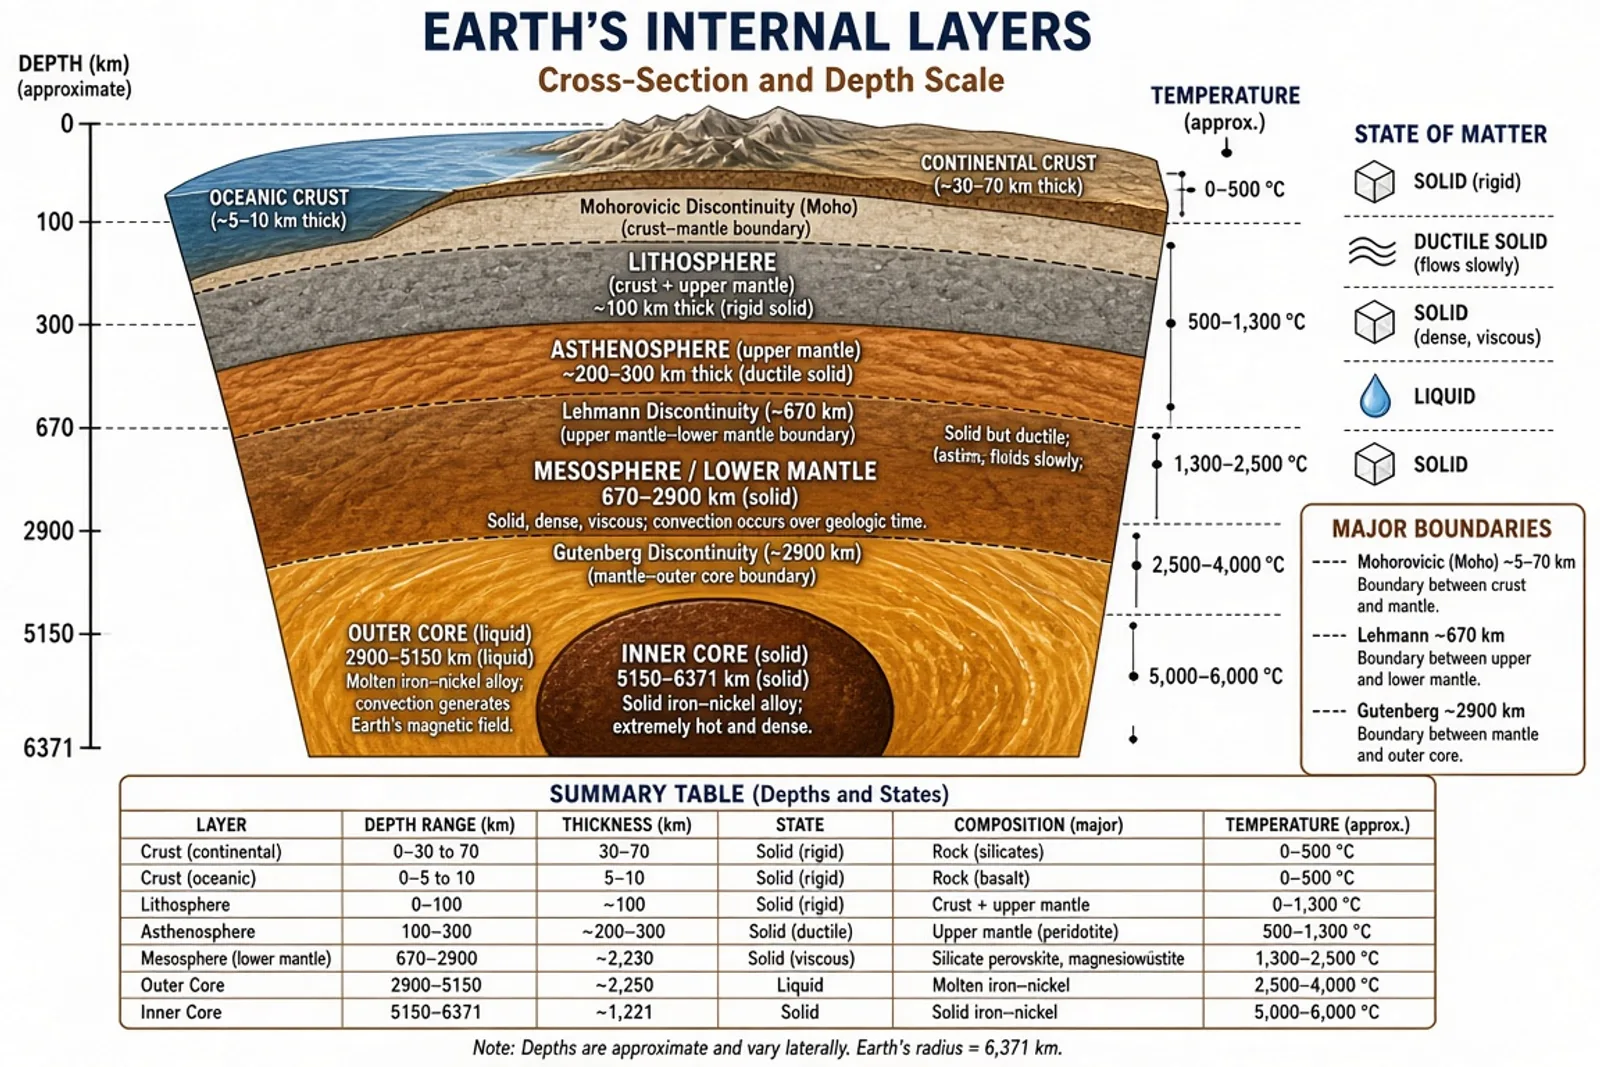 Earth Layers Diagram — AI GeneratorView · earth-science
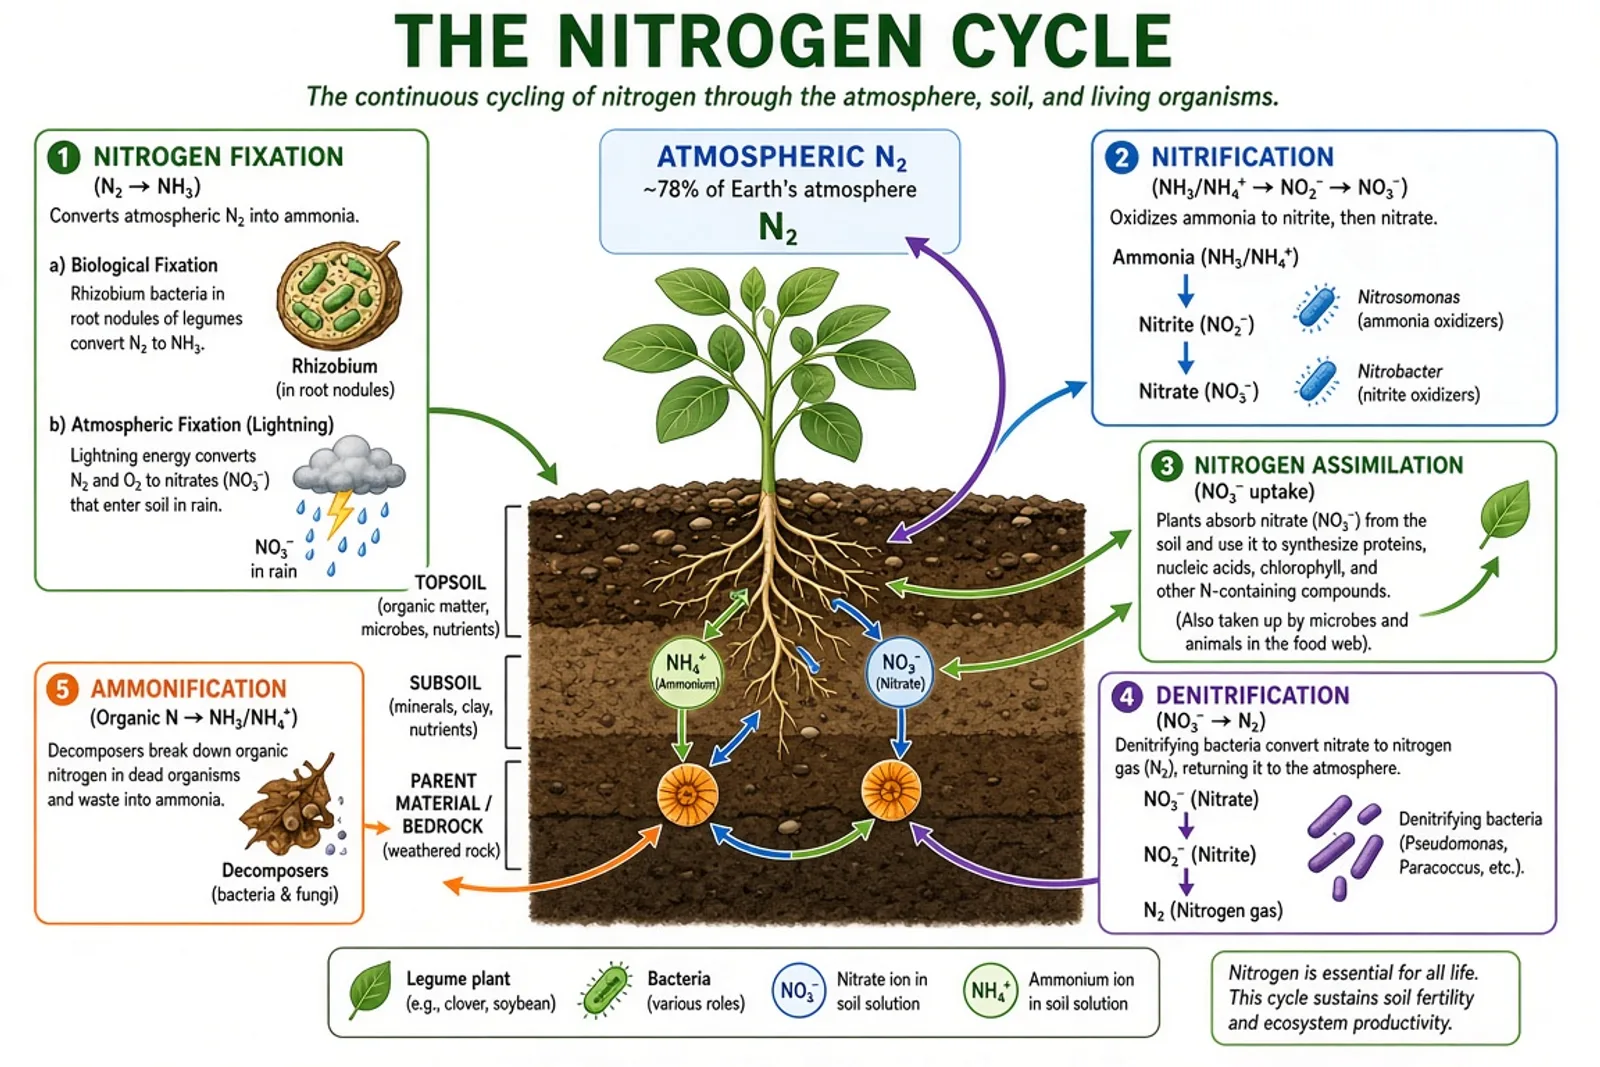 Nitrogen Cycle Diagram — AI GeneratorView · earth-science
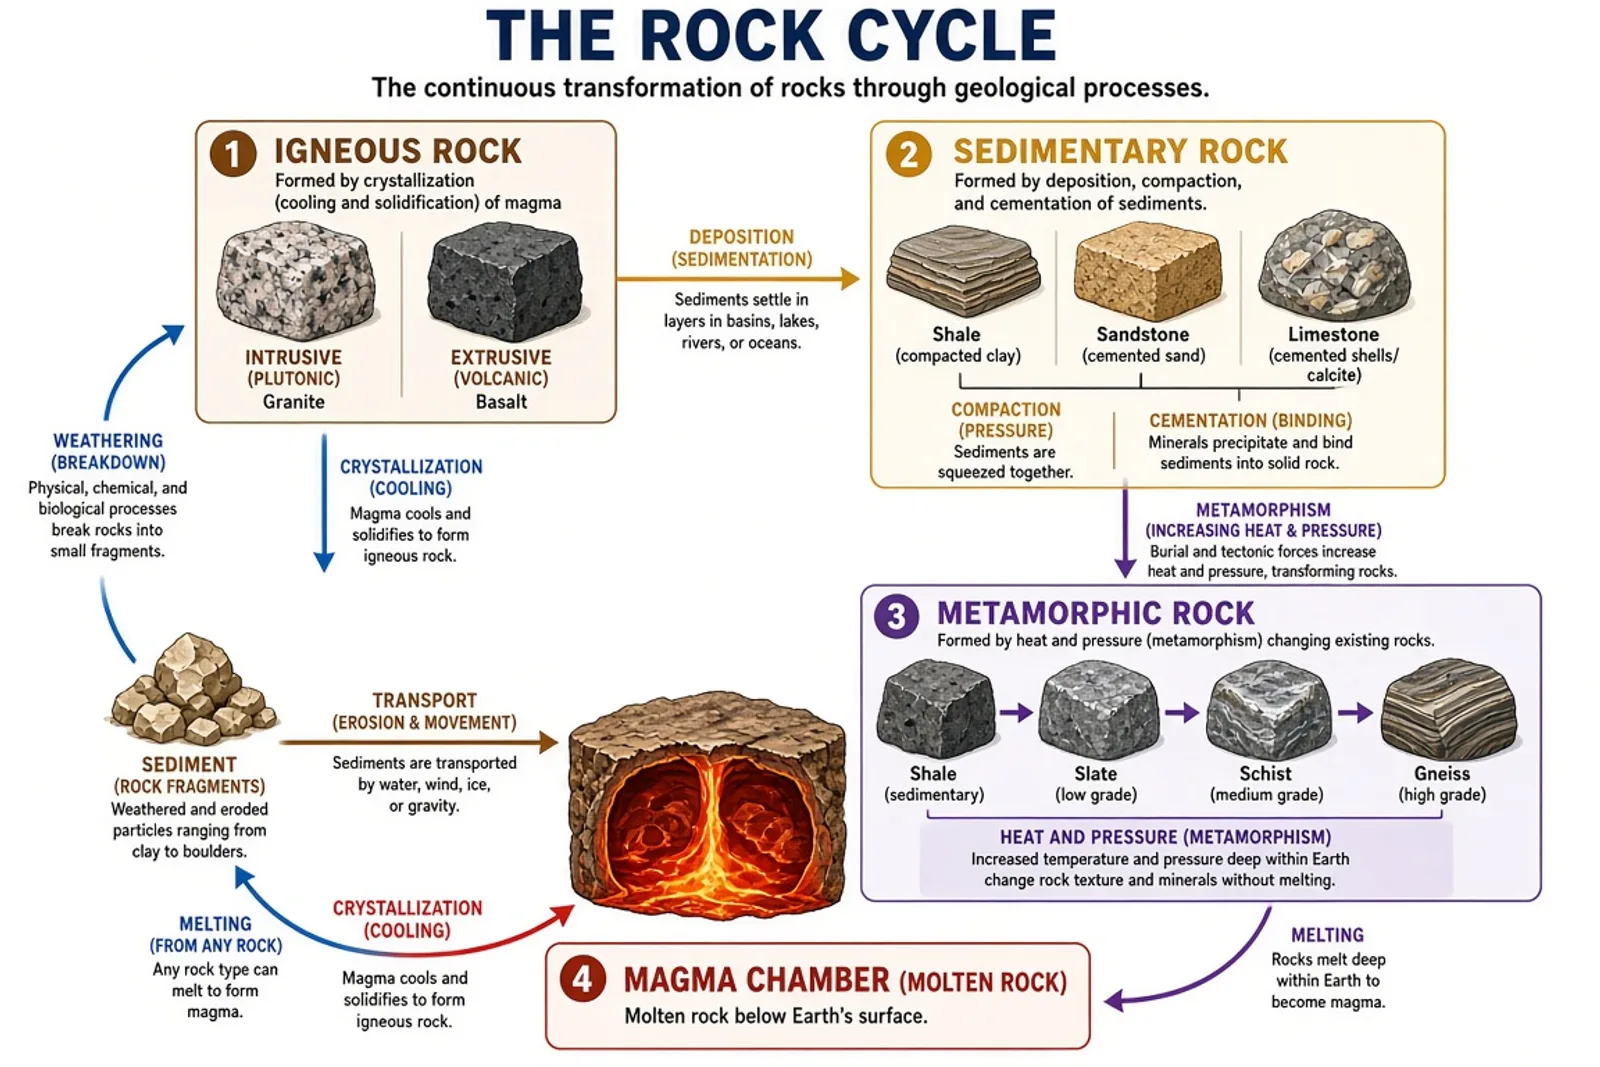 Rock Cycle Diagram — AI GeneratorView · earth-science
Frequently asked questions
What should a simple carbon cycle diagram include?
A simple version usually includes atmospheric carbon dioxide, plants, animals, soils or decomposers, oceans, photosynthesis, respiration, decomposition, and combustion. Add geological storage and transfers for a more complete Earth-system view.
What is the difference between a reservoir and a flux?
A reservoir stores carbon, such as the atmosphere, ocean, soil, biomass, or rock. A flux is a transfer between reservoirs, such as photosynthesis, respiration, air-sea exchange, burial, weathering, or combustion.
Can the diagram show human effects?
Yes. Fossil-fuel combustion and land-use change can be shown as transfers, but any quantities or comparisons should come from a cited dataset and be reviewed for scope and date.