APPLIED SCIENCE
Engineering & Technical Systems
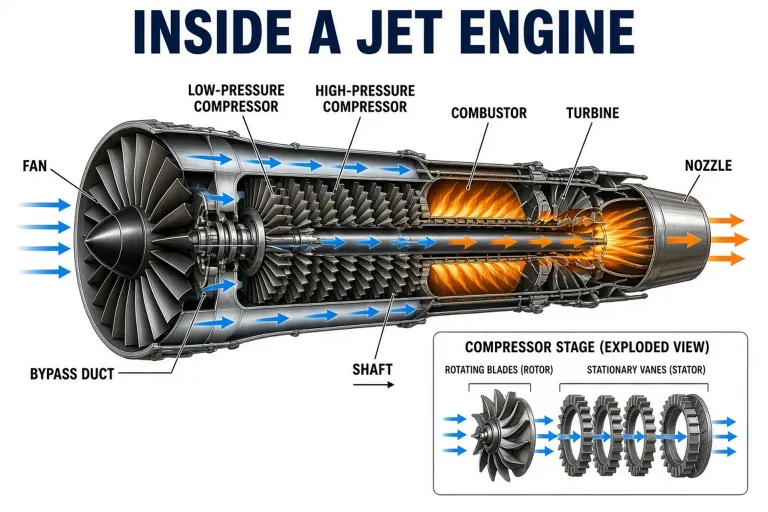
Machine and system cutaways with connected, labeled components.
- Cutaways
- Process flow
Text to Diagram · Structure & Flow
Diagrams are how science explains mechanism: labeled components, correct arrows, honest scale relationships. Describe the system and get a diagram that follows figure conventions — cutaways, cycles, flows, and setups.
Use this focused workflow when relationships matter more than realism: components, stages, arrows and spatial hierarchy. It is designed for mechanisms and systems rather than specimen plates or decorative science art.

APPLIED SCIENCE
Machine and system cutaways with connected, labeled components.
LIFE SCIENCES
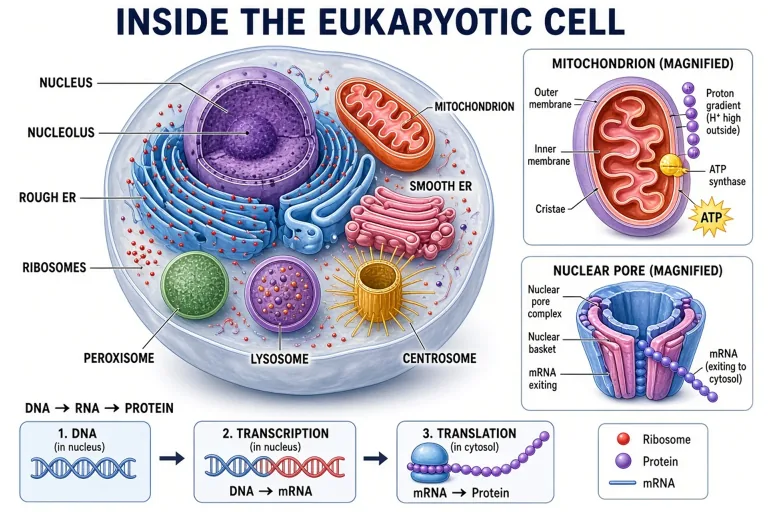
Molecular mechanisms and cellular processes with directional cues.
EARTH SCIENCE
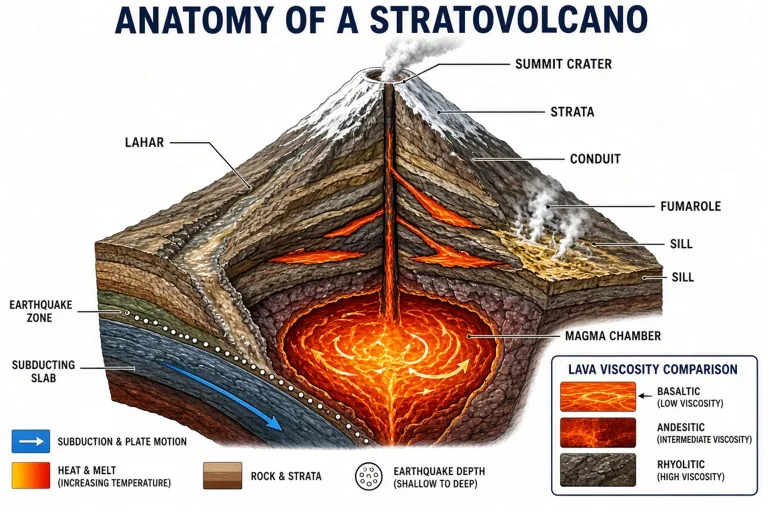
Cycles, cross-sections, and earth-system flows.
Made with GLMImage
Browse process diagrams, system cutaways and cycles, then start with a prompt that names every component and relationship.
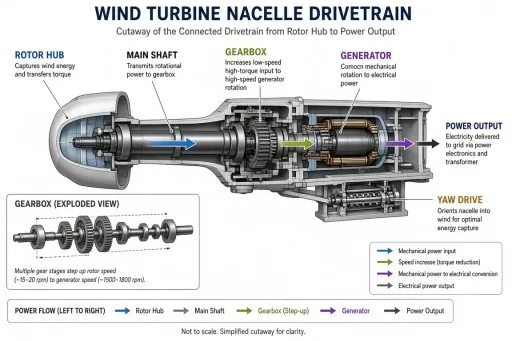 Wind turbine nacelle (validation)
 Blockchain network topology
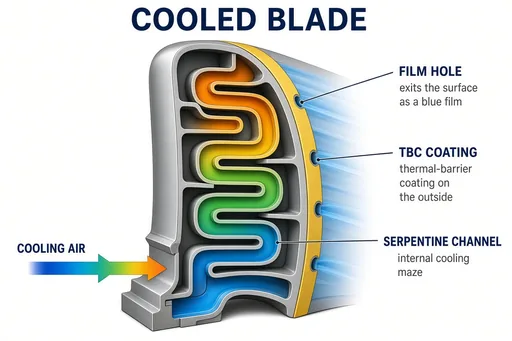 Turbine blade cooling channels
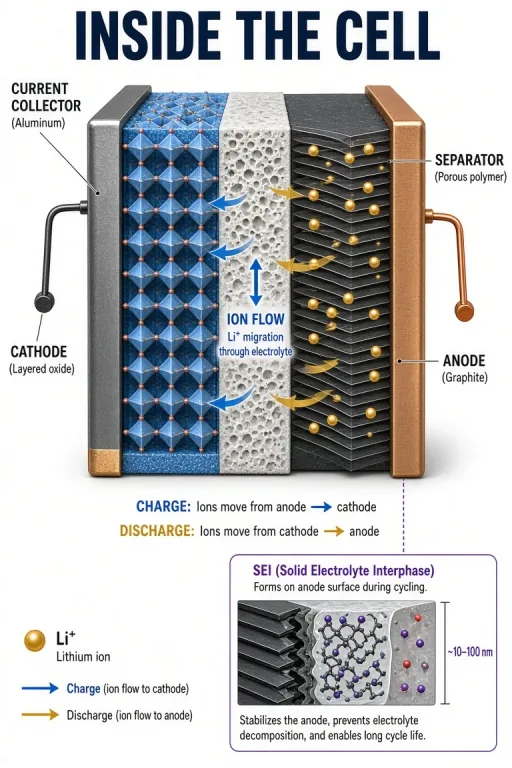 Lithium-ion battery cell
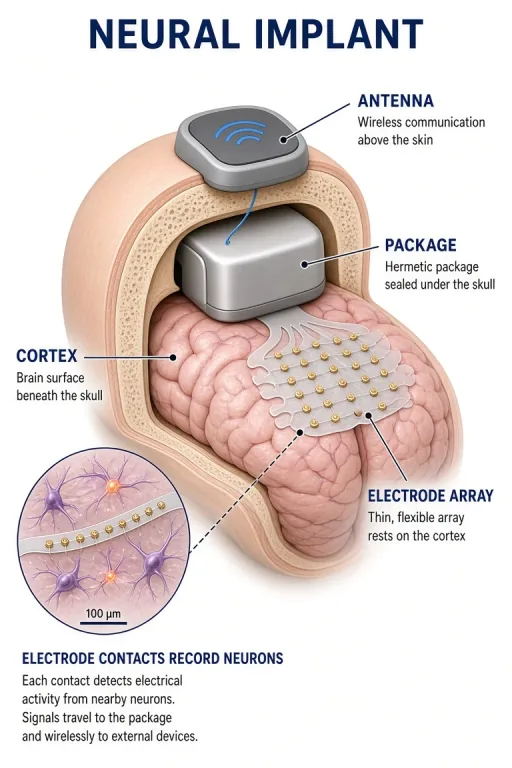 Neural implant interface
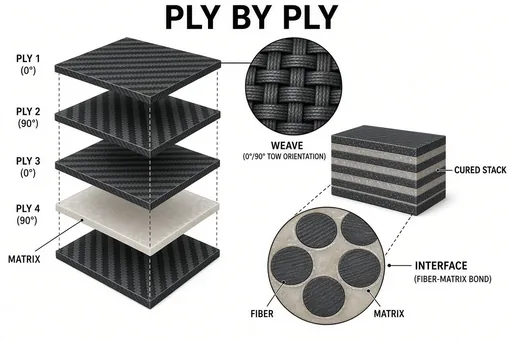 Carbon fiber laminate plies
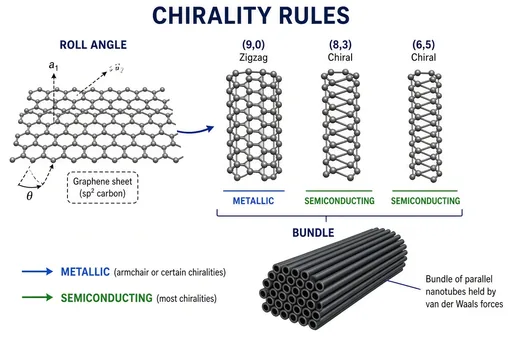 Carbon nanotube chirality
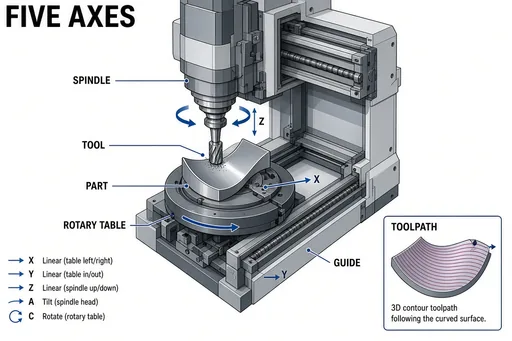 Five-axis milling machine
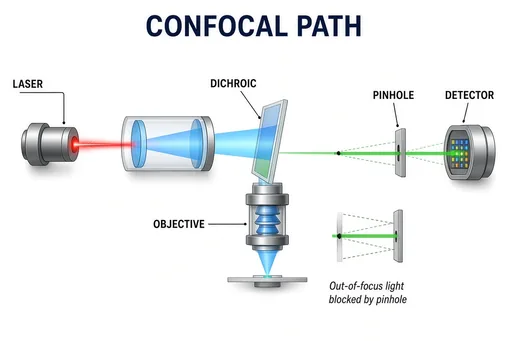 Confocal laser scanning microscope
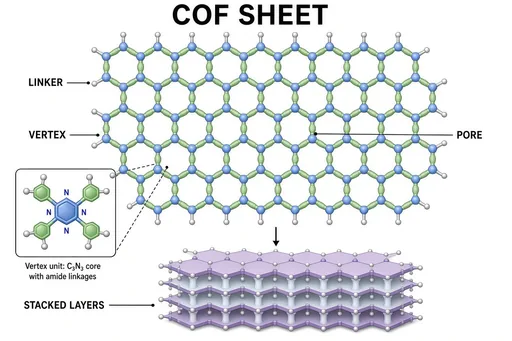 Covalent organic framework sheet
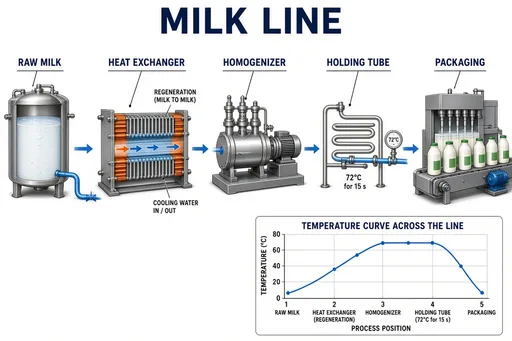 Dairy pasteurization line
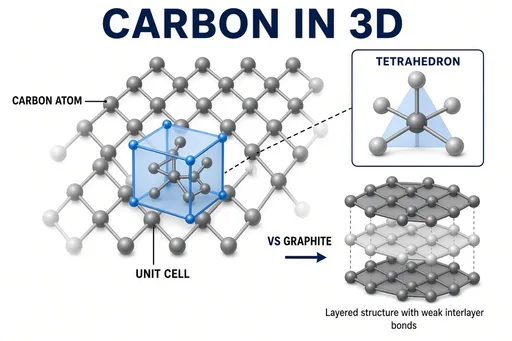 Diamond crystal lattice
Focused workflow
What mechanism or setup the diagram must explain.
Components as labels, flows as arrows — order matters.
Direction errors are the most common flaw; fix them first.
Inside/outside, upstream/downstream — against a reference figure.
Practical starting points
Use these as structures, not magic phrases. Replace the subject, purpose and constraints with details from your own project.
Create a labeled diagram of photosynthesis showing "light energy", "water", "carbon dioxide" as inputs and "glucose", "oxygen" as outputs, with the light-dependent reactions and the Calvin cycle as labeled stages.
Biology · process diagram
Create a labeled cutaway diagram of a hydroelectric dam showing the reservoir, intake, penstock, turbine, generator, transformer, and power lines, with water flow arrows.
Engineering · system cutaway
Create a labeled carbon cycle diagram showing photosynthesis, respiration, decomposition, combustion, and ocean dissolution, with carbon-flow arrows between atmosphere, biosphere, ocean, and geosphere.
Earth system · cycle diagram
A scientific diagram earns its place by making a mechanism legible: every component named, every arrow meaningful, nothing decorative. The diagram-oriented recipes — technical, biology, earth science — enforce that style: clean linework, leader-line labels, and arrows that follow the actual process direction.
Common targets include photosynthesis and rock cycles, engineering cutaways, molecular mechanisms, and lab setups — the figures that normally cost an illustrator hours of layout.
Name the system, list the components in order, and state the flows. "A labeled diagram of photosynthesis showing light energy, water, carbon dioxide inputs, glucose and oxygen outputs, with the light-dependent and Calvin cycle stages" is a complete brief — the recipe builds the layout.
For setups and cutaways, anchor on spatial truth: what is inside what, what connects to what. Iterate arrows early; they are the hardest element to get right and the most damaging when wrong.
Guides for diagram-driven scientific illustration.
Process flows, cycle diagrams, system cutaways, experimental setups, and comparison charts — any figure where labeled components and arrows carry the meaning.
Usually, but arrows are the element most worth checking. State flows explicitly in the prompt ("with water flowing from reservoir through penstock to turbine") and verify each arrow against the mechanism before use.
Yes — ask for a clean textbook or journal-figure style: minimal color, leader-line labels, white background. The result is a draft you can annotate further or use directly in teaching material.
Review the current terms and any third-party rights that apply to your source material before publishing. For peer-reviewed journals, textbooks, or patient education, treat every AI illustration as a draft: verify structures against an authoritative atlas and have a domain expert sign off before publication. New accounts can try 2 free images before choosing a plan.
List the components, connections and direction of flow. Generate the layout, check every arrow and relationship, then refine one variable at a time.
Create a scientific diagram